|
Science and Art come together in Textile Dye, Yarn and Fiber Analysis.
|
Call Casey Reed @ 505-344-8492 Textiles are usually analyzed from an art history point of view. Using stylistic elements and colors people make judgements about old textiles, but a multidisciplinary approach is possible. Art history and science meet when objective dye, yarn and fiber evidence is combined with ethnology, historical dye, yarn, and fiber use, and technical analysis, and of course stylistic elements from art history studies. How
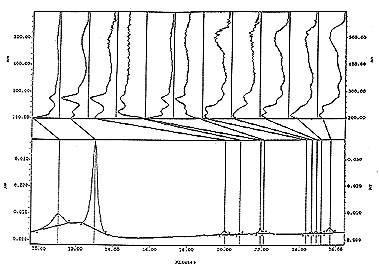
is dye analysis accomplished or determined? The spectral information (that is illustrated below) is used to identify the dye from a red scale insect called Cochineal using High Pressure Liquid Chromatography (HPLC), and the PDA (Photodiode Array Detector). This detector utilizes diodes that receive specific light or are able to generate a signal from light frequencies 2nm apart. There are 300 diodes 2nm apart so we can look at 600nm of different light frequency. The spectra above is from the detector tuned to 200nm to 600nm. The high points on a graph represent intensity and the bottom line represents frequency. The PDA is tuned from 200nm to 800nm for indigoid testing, and adjusted for 200nm to 600nm for most other dyes. Data or spectras are illustrated below in (fig. 1 Spectral Referencing - Standards-). The image and table at the bottom left (fig. 1) is an image from one of the computerized libraries standards - a dye component spectra (carminic acid), but this standard is also superimposed over one of the sample's spectra from the dye found in a yarn of raveled wool that was with another raveled wool yarn. Four of the standard spectras of Cochineal's carminic acid matched in (fig. 1 left side ) with the sample of dye from the raveled yarn's spectra, which is the larger peak in the chromatograph in (fig. 2 right side). Both samples were from a hand twisted raveled (machine z-spun) with a (machine s-spun) yarn to form a 2-ply yarn. Each of the raveled yarns had different dyes. The dominant quantity of dye indicated by the large peaks in (fig. 2 left side) are synthetic orange dye spectras. The comparison with the published spectra on the right is to illustrate how a standard in one method's spectral read out on cochineal in Brussels, Belgium by Jan Wouters can be compared to the read out obtained and established in a computerized library here in New Mexico, United States of America. Both labs identified the same component "ca" (Carminic Acid) the main dye component in American Cochineal (dactylopius coccus costa), and in Armenian Cochineal (Prophyrophora hamelii), and in Polish Cochineal (Porphyrophora polonica). These different forms of cochineal can be identified by quantifying different dye components spectrally identified on a chromatograph. We make peak area comparison with the same identified dye component peaks in each of the chromatographs say in American cochineal and Armenian cochineal. The peak areas on each chromatograph are consistent and comparable. This gives us the evidence for the type of cochineal identification. The real advantage of the PDA and HPLC is one can identify peaks that may co-elute and separate mixtures. It is also possible to view the detector's data from different frequencies and all the associated spectral data with each peak. The detector was tuned to 274nm for all of the spectral graphics and chromatographic illustrations in (fig. 1 to fig. 3) below.
fig. 1, Spectra Reference - Standards - from our computerized library in New Mexico on the left side compared to spectral data from a yarn sample. Spectral referencing standard from published material from the Annales de la Societe Entomologique de France 25(4):393-410, on the right side.
|
